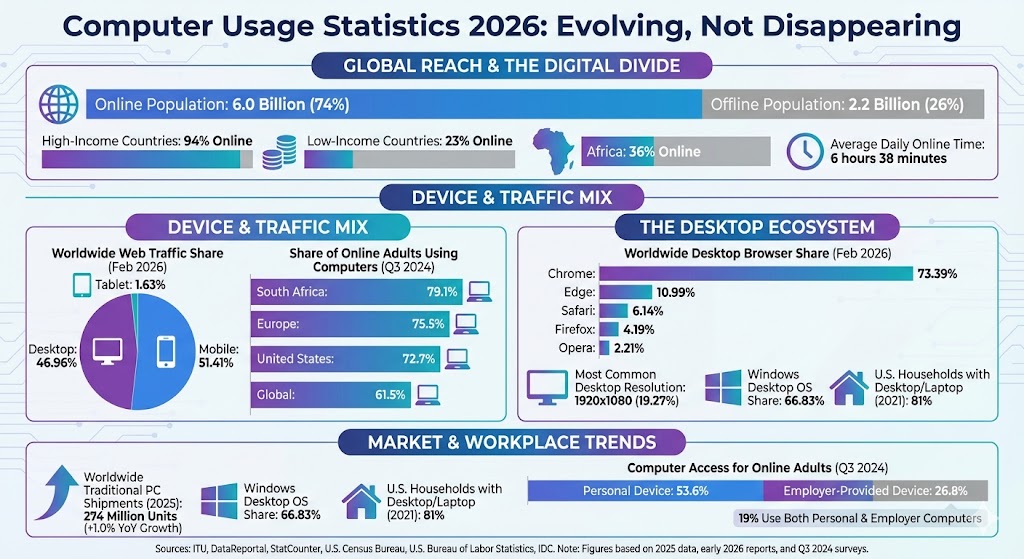
Computer usage in 2026 is evolving rather than disappearing. Mobile now leads worldwide web traffic, but desktops still account for nearly half of all page requests, laptops and desktops remain common access devices for online adults, and the global PC market returned to growth in 2025.
computer usage statistics
Key computer usage statistics
ITU estimates that 6.0 billion people were online in 2025, equal to 74% of the world’s population.
About 2.2 billion people remained offline in 2025, showing that computer and internet access gaps are still large globally.
Internet use reached 94% of the population in high-income countries in 2025, versus 23% in low-income countries.
Africa’s average internet use rate was 36% in 2025, far below the global average of 74%.
Adult internet users worldwide spent an average of 6 hours and 38 minutes online per day in early 2025.
61.5% of online adults used laptops or desktops to access connected services in Q3 2024.
53.6% of online adults used their own laptop or desktop, while 26.8% used a device provided by their employer.
Roughly 19% of respondents said they used both a personal computer and an employer-provided computer for internet access.
Computer-based internet access remained especially strong in Europe, where 75.5% of internet users said they use laptops or desktops to go online.
In the United States, 72.7% of internet users still used computers to access the internet, while South Africa stood at 79.1%.
Desktop accounted for 46.96% of worldwide web traffic in February 2026, compared with 51.41% for mobile and 1.63% for tablet.
Windows held 66.83% of worldwide desktop operating system market share in February 2026.
Chrome led worldwide desktop browser usage in February 2026 with 73.39% share.
The most common desktop screen resolution worldwide in February 2026 was 1920×1080 at 19.27%.
Desktop or laptop computers were present in 81% of U.S. households in 2021.
On an average day in 2024, Americans spent 34 minutes playing games and using a computer for leisure.
IDC reported that worldwide traditional PC shipments reached 274 million units in 2025, up 1.0% year over year.
Share of online adults using computers to access the internet
Global averages still matter, but regional differences are significant. South Africa, Europe, and the United States all sit well above the global average for laptop and desktop internet use.
Label
Bar
Value
Global
61.5%
United States
72.7%
Europe
75.5%
South Africa
79.1%
Max = 79.1. Widths: Global 77.75%, United States 91.91%, Europe 95.45%, South Africa 100.00%.
Worldwide web traffic share by device type
Mobile leads globally, but desktop usage remains too large to ignore in content design, software testing, and workplace workflows.
Label
Bar
Value
Mobile
51.41%
Desktop
46.96%
Tablet
1.63%
Max = 51.41. Widths: Mobile 100.00%, Desktop 91.34%, Tablet 3.17%.
Worldwide desktop browser share
Desktop browsing remains highly concentrated, with Chrome far ahead of every other browser in early 2026.
Label
Bar
Value
Chrome
73.39%
Edge
10.99%
Safari
6.14%
Firefox
4.19%
Opera
2.21%
Max = 73.39. Widths: Chrome 100.00%, Edge 14.97%, Safari 8.37%, Firefox 5.71%, Opera 3.01%.
U.S. household device ownership
U.S. device ownership data shows that smartphones are most common, but desktop and laptop access still reaches a large majority of households.
Label
Bar
Value
Smartphone
90%
Desktop or laptop
81%
Tablet
64%
Max = 90. Widths: Smartphone 100.00%, Desktop or laptop 90.00%, Tablet 71.11%.
Computer market and workplace statistics
IDC said worldwide traditional PC shipments totaled 274 million units in 2025.
That marked 1.0% annual growth after two years of market contraction.
Notebook demand remained the main volume driver in the traditional PC market.
Employer-provided computers were used by 26.8% of online adults globally in Q3 2024.
Personal computers were still slightly more common than work-provided devices, at 53.6% of online adults globally.
What these computer usage statistics show
These computer usage statistics show that computers remain central to how people work, browse, study, and play. Phones dominate overall traffic, but desktops and laptops still represent a major share of web activity, remain common household devices, and continue to anchor workplace productivity. That makes computer usage a multi-device story rather than a desktop-only or mobile-only story.
Sources
ITU, Facts and Figures 2025: https://www.itu.int/en/ITU-D/Statistics/Pages/StatisticsUpdate/December2025.aspx
ITU, Internet use by income group and region, 2025: https://www.itu.int/itu-d/reports/statistics/2025/10/15/ff25-internet-use/
DataReportal, Digital 2025 Global Overview Report: https://datareportal.com/reports/digital-2025-global-overview-report
DataReportal, Digital 2025 Device Trends: https://datareportal.com/reports/digital-2025-sub-section-device-trends
Keep your workflows lightning-fast with the top 10 NVMe NAS enclosures that promise to elevate your system's performance—discover which ones make the cut!